Heat Maps
A heat map uses the business capability model. There are two principal reasons to create and use a heat map. The first is to expose organisational boundaries. In simple terms this means:
- Identifying the main groups within the organisation. This can usually be done by looking at an organisational chart and finding the principal managers,
- Allocating business capabilities to those groups based on who has responsibility for the conduct of that capability.
In our Cellar Door example, the Head Chef and his team own the Kitchen capability which is pretty obvious. The value of this kind of heat map becomes apparent when ownership is not straight forward. For example, the Head Chef owns the Kitchen capability, but also has a major say in the Planning the Offering capability, even though that may be owned by the Marketing Manager. For the Planning the Offering capability therefore, collaboration is key and if people can work together then all is good. But that need for collaboration raises a flag - that area needs watching to ensure all is running smoothly.
The other use of the heat map is to identify which systems support the capabilities. For example, the Financial Management capability is very heavily dependent on the financial system, which in turn is integrated into the systems of a bank, the booking system and the payment systems.
Once we have both maps we can see from an organisational point of view how capabilities are supported by systems, who is responsible for operating those systems and now, how a new system like a CRM would fit into and support the organisation as a whole.
Other opportunities include:
- Looking at the business capability model and heat maps, and redefining or reorganising capabilities to create a better fit (higher cohesion, looser coupling),
- Identifying risks, issues, threats and opportunities (more of which later) associated with existing or new systems which may not have been apparent before.
Following is our Cellar Door business capability model with the systems heat map overlay. A first look at how the CRM may support capabilities has also been included.
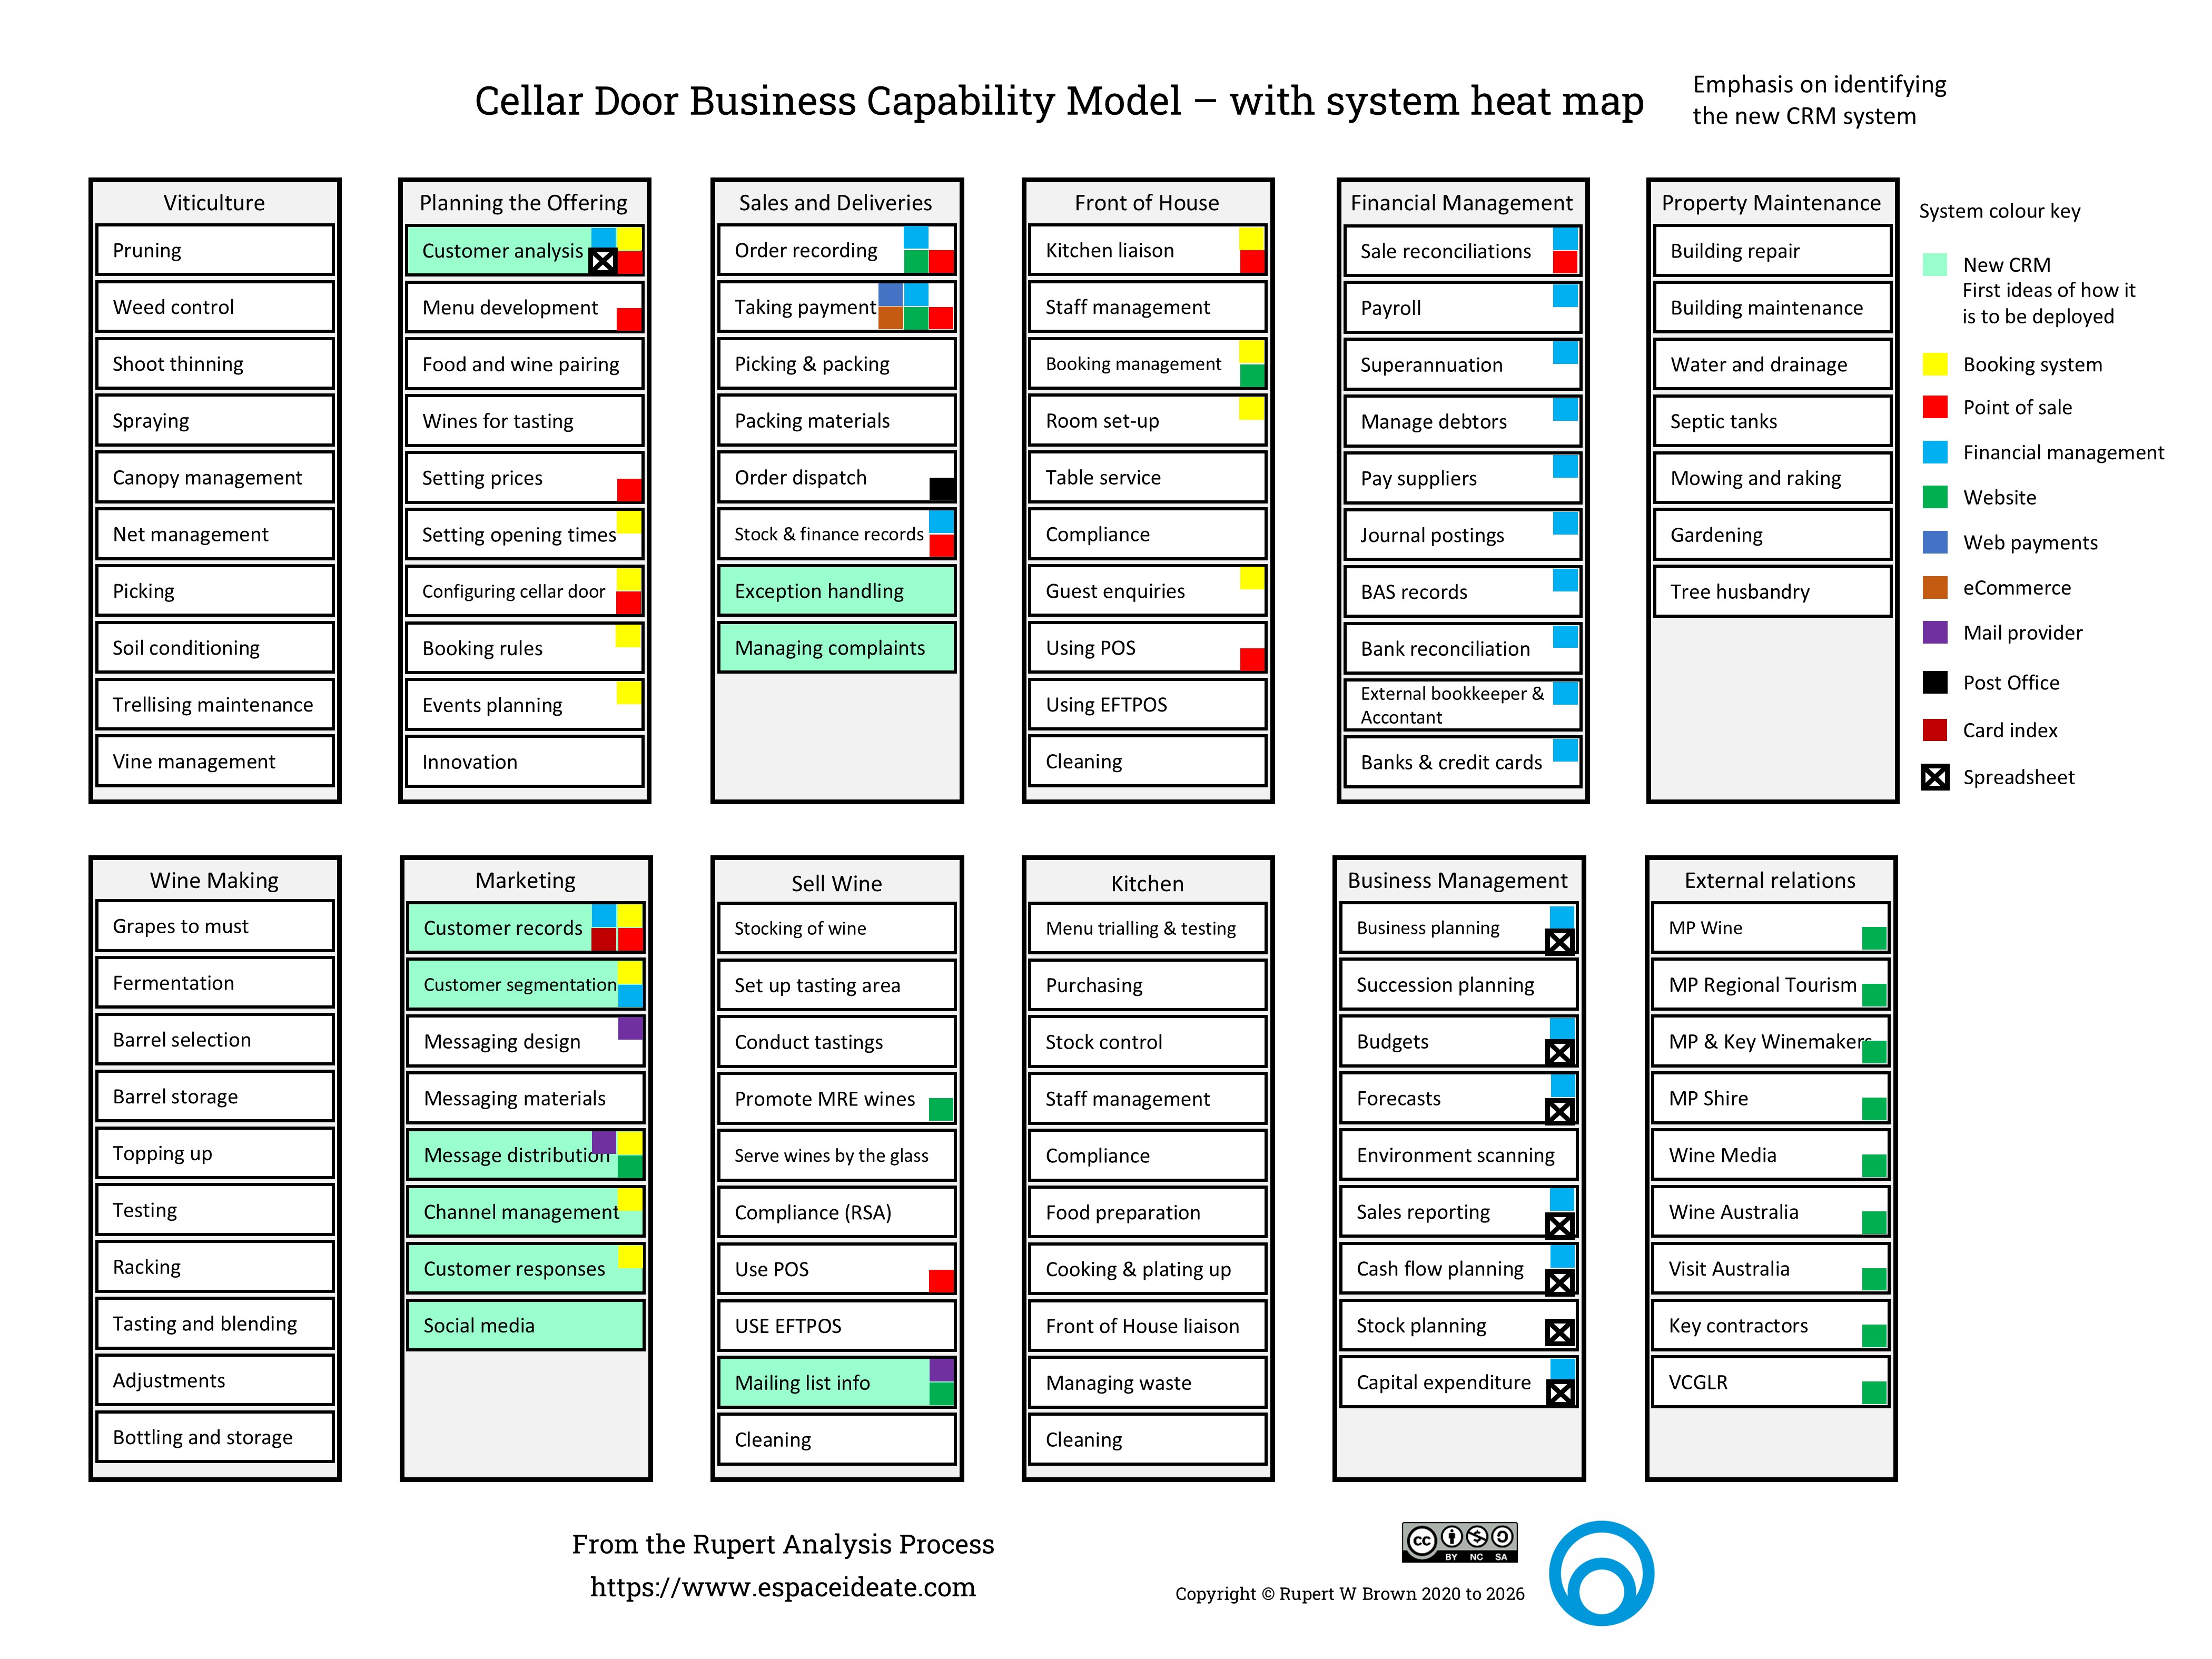
The Cellar Door business capability model with the systems heat map overlay.
Based on that initial heat map overlay of the business capability model, it becomes possible to think about drawing simple high level system diagrams with data flows to get a sense of how a CRM would be integrated into the organisation. The existing As Is diagram looks like this:
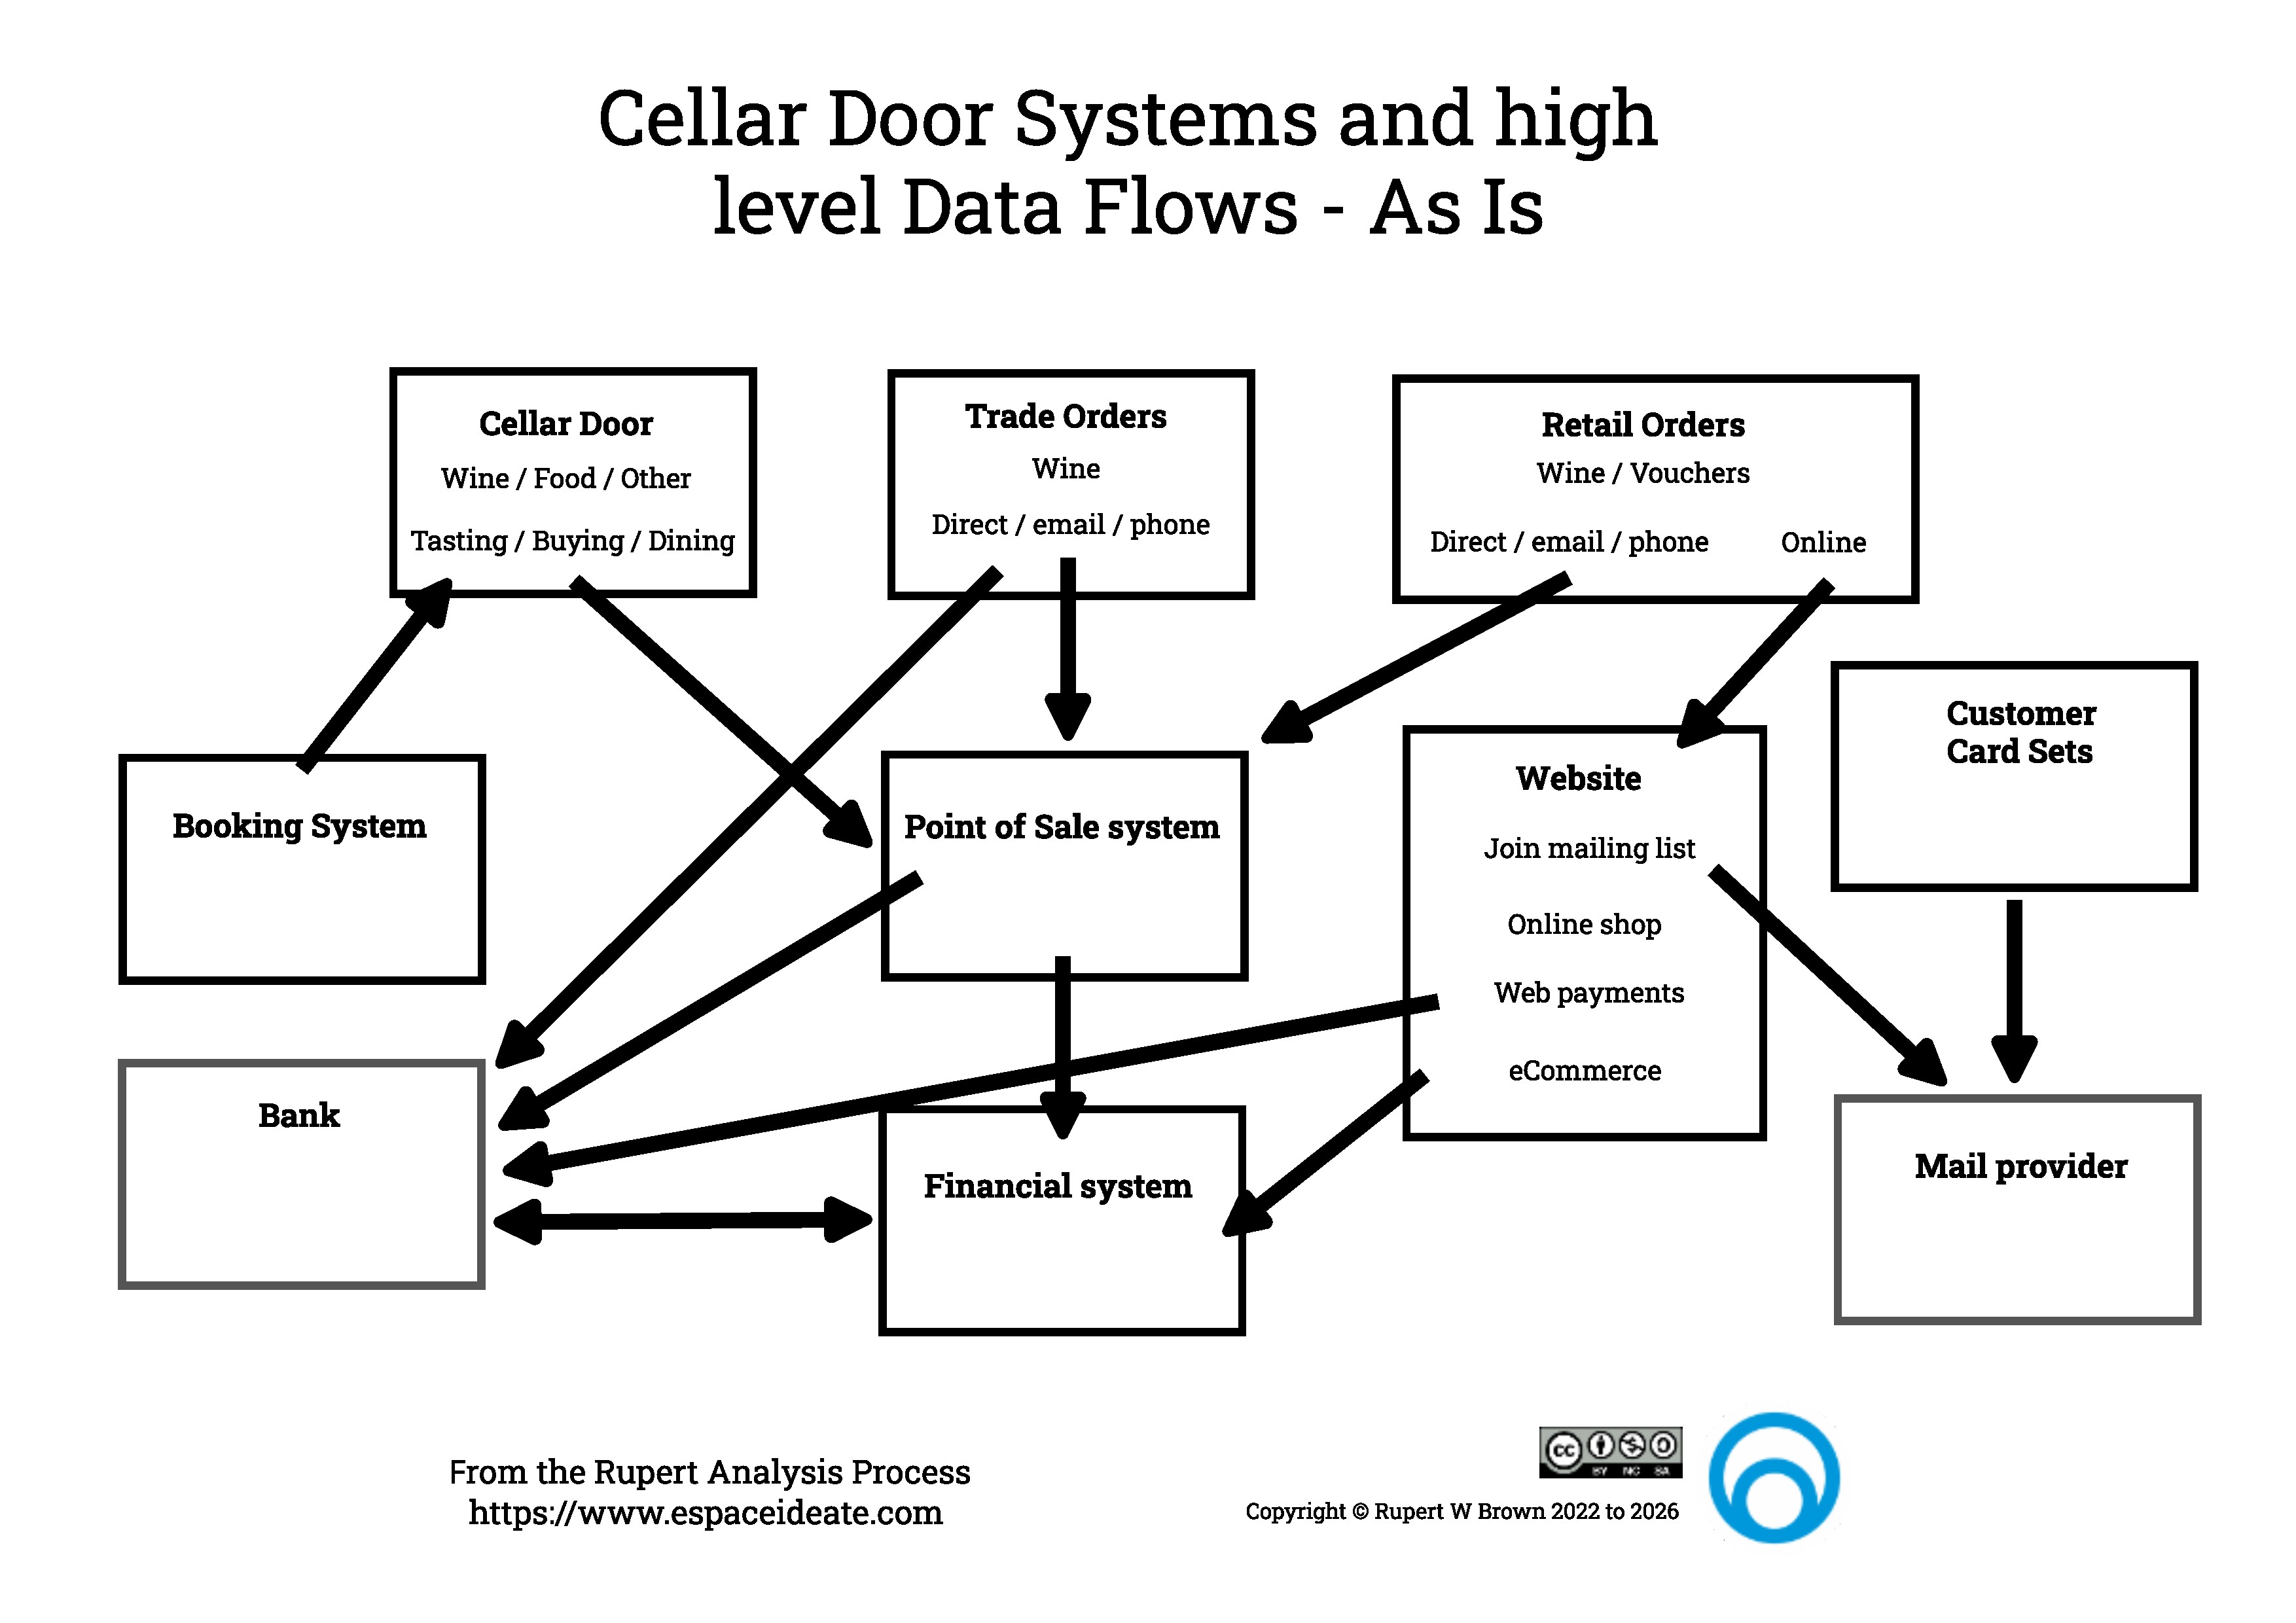
The Cellar Door As Is System Diagram with data flows.
The To Be changes the diagram to look like this:
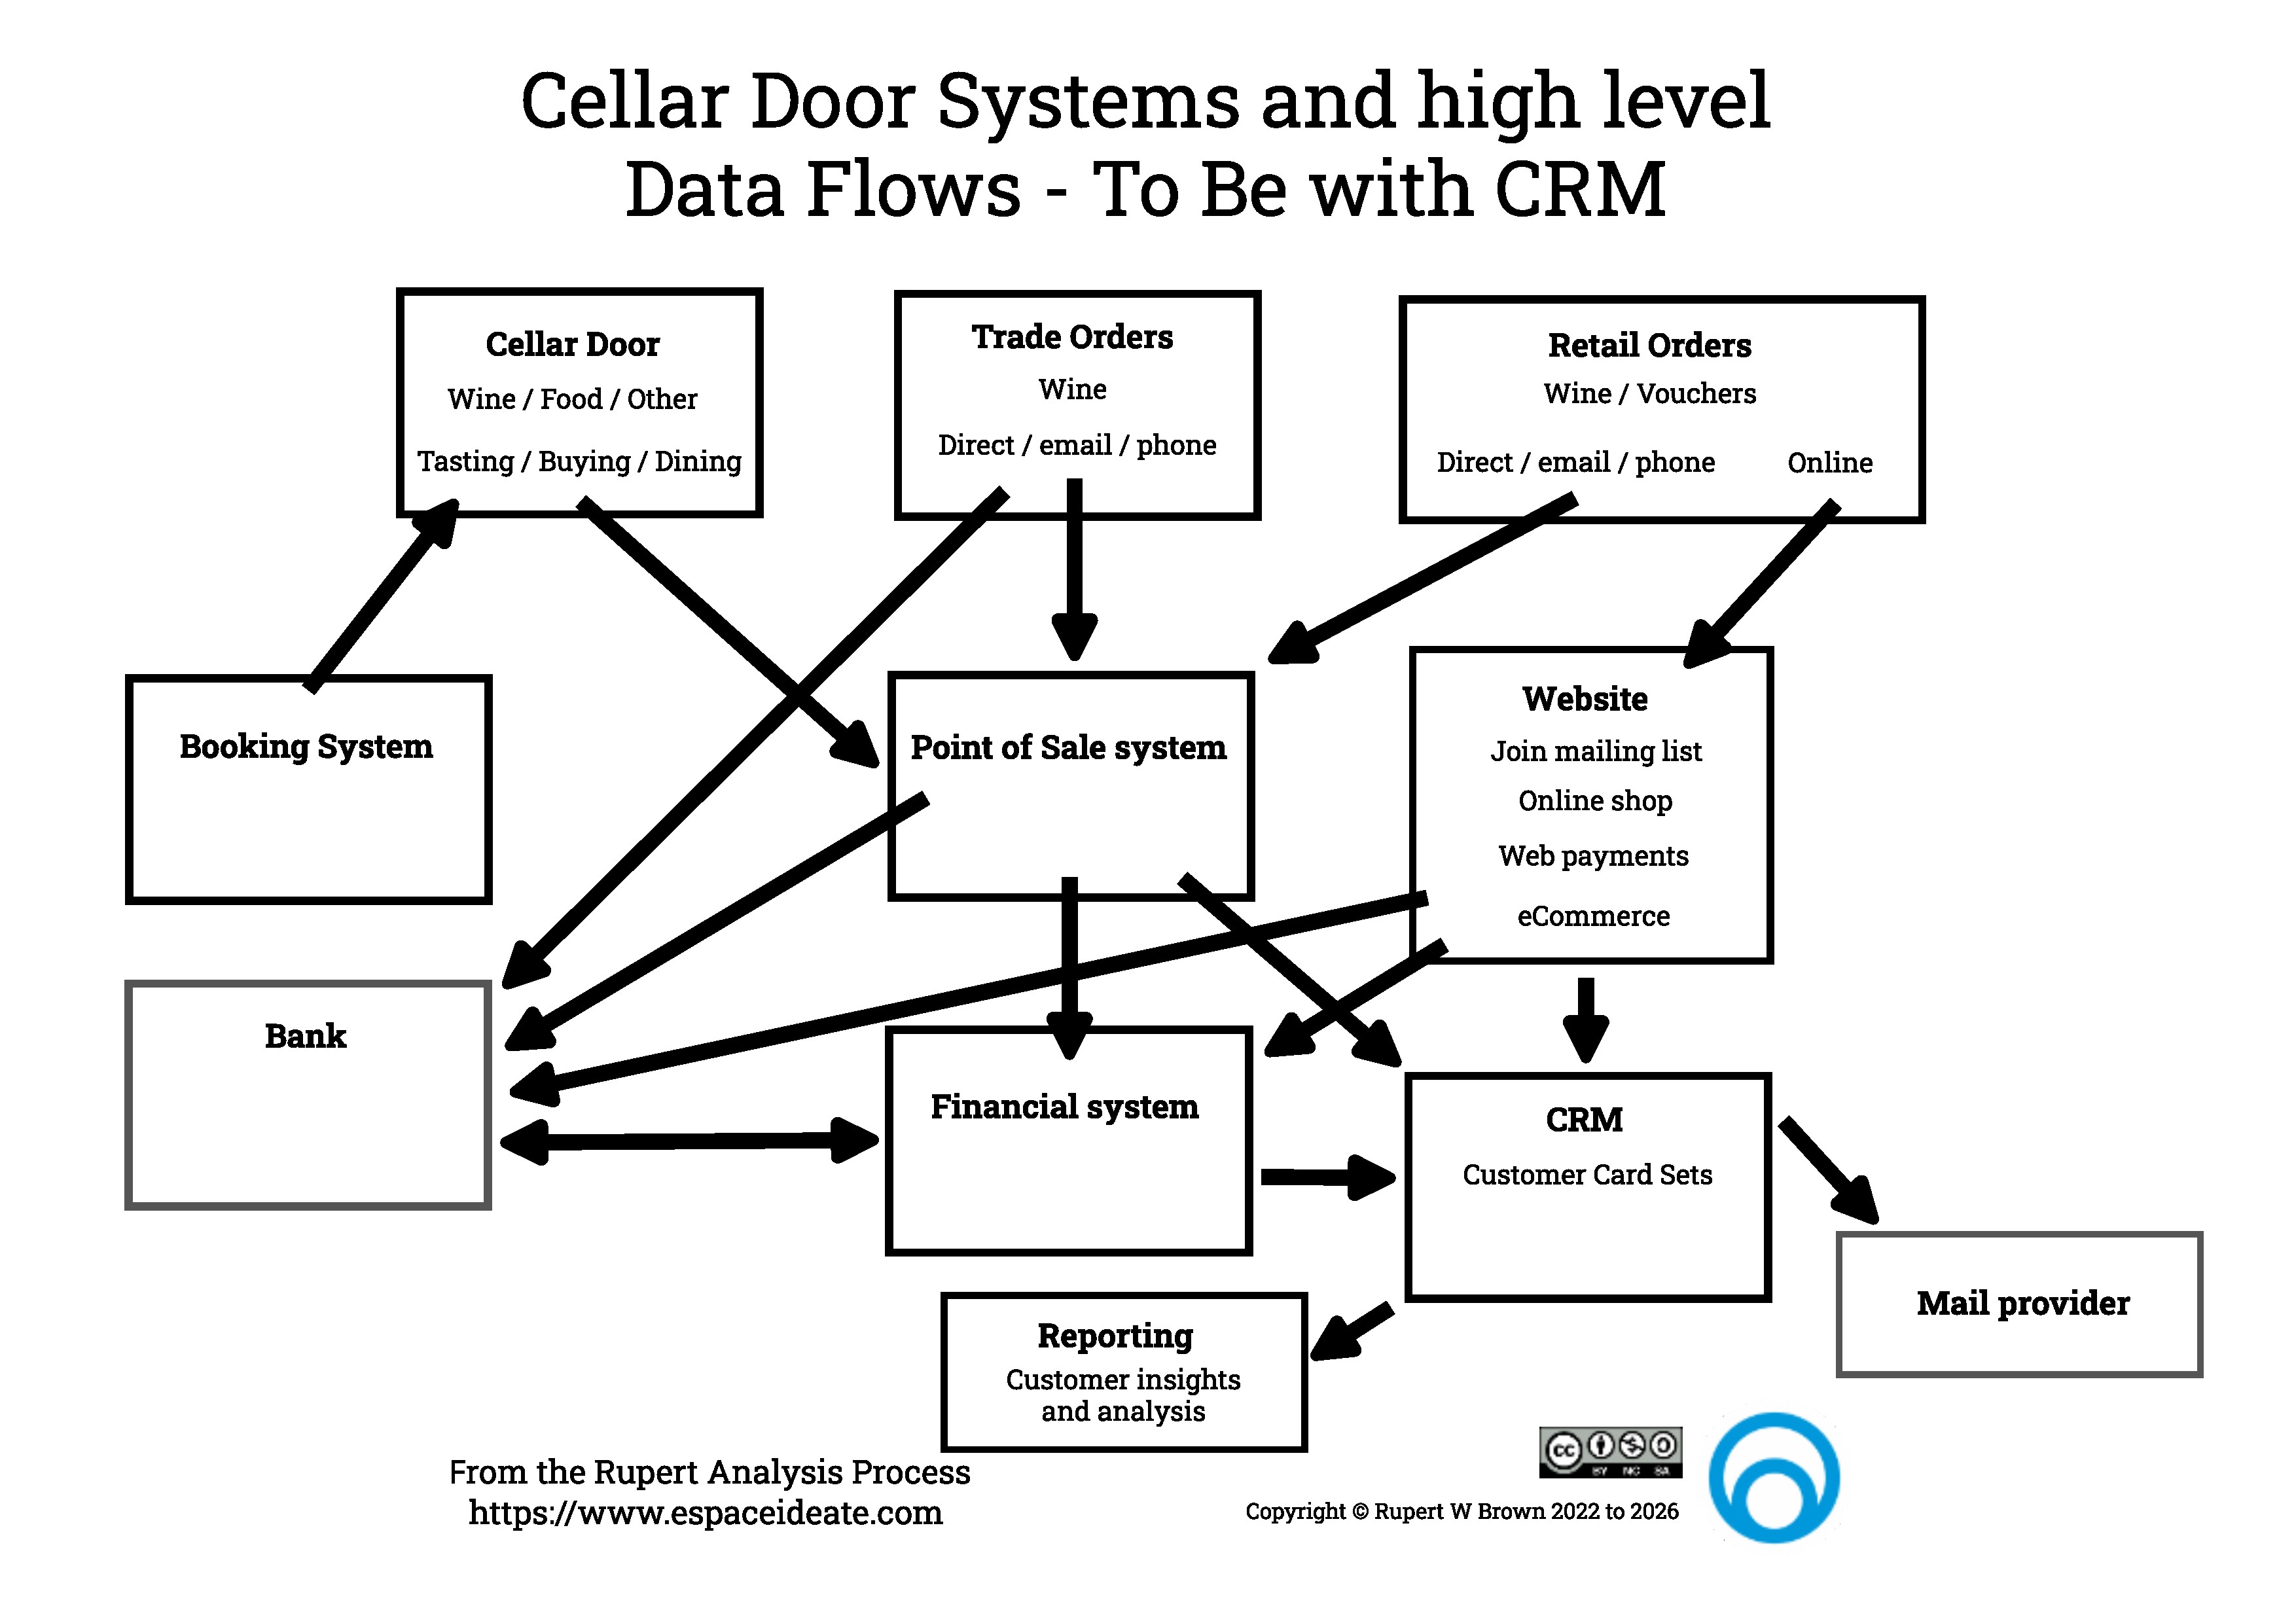
An intial Cellar Door To Be System Diagram with data flows.
At first glance the change doesn't look huge, but two significant things have happened:
- All the information in the old card sets now lives as electronic data in the CRM system. It can be searched, and new activity is automatically recorded,
- There is a new reporting function that comes from the CRM data. This new function should give the Cellar Door much greater insights into their customers' behaviours, allowing them to develop new wine selling strategies and campaigns.
Another important step to take at this stage is to gather metrics - hard data on what is going on. In this case it would be things like:
- The number of Cellar Door customers by day, month, year,
- Their $ spend,
- The most popular wine types - if possible captured against customer age, gender,
This will also prompt thinking around data types and formats and help to answer questions like:
- How do we identify a customer?
- Should every one of our wines be given a unique identifier?
- If we are wine and food pairing, how do we identify the dishes on the menu?
Of course all of that good thinking and data needs to be captured and thought about further.